IC Markets Home Sign in Web Trader Contact Us
IC Markets Social IC Markets Social

Information Hub for
Serious Traders

  • ABOUT US
  • OPEN LIVE ACCOUNT
  • OPEN DEMO ACCOUNT
  • TRADE NOW
  • VISIT OUR BLOG
IC Markets Social
  • ABOUT US
  • OPEN LIVE ACCOUNT
  • OPEN DEMO ACCOUNT
  • TRADE NOW
  • VISIT OUR BLOG
December 29, 2023North_American_Stocks_esIC Markets

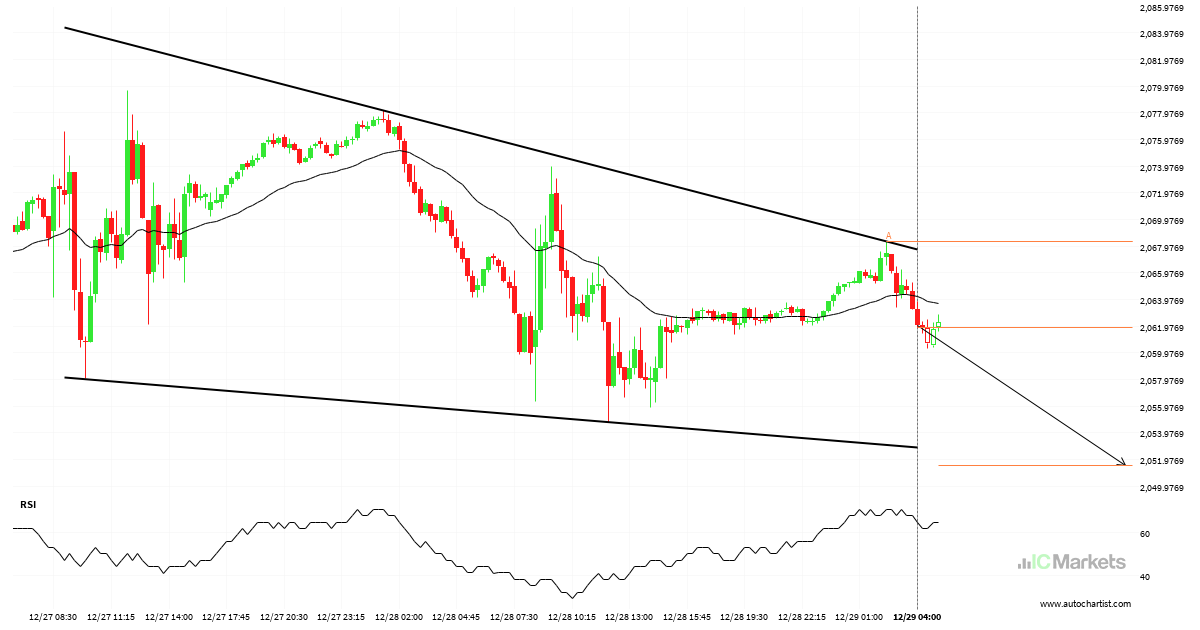
¿Deberíamos esperar una ruptura o una recuperación del US Small Cap 2000 Index?

El movimiento del US Small Cap 2000 Index hacia la línea de soporte de un Cuña descendente es otra prueba más de la línea que ha alcanzado en numerosas ocasiones durante el pasado. Esta prueba de la línea podría ocurrir en las próximas 12 horas, pero no sabemos si dará como resultado una ruptura a […]

Read more
December 28, 2023North_American_Stocks_esIC Markets

Microsoft Corporation acercándose a nivel de soporte

El precio de Microsoft Corporation ha vuelto a la zona de soporte. Es posible que tenga dificultades para atravesarla y que retroceda en la otra dirección. El precio eventualmente puede romper, pero normalmente el precio rebota en el nivel varias veces antes de hacerlo.

Read more
December 25, 2023North_American_Stocks_esIC Markets

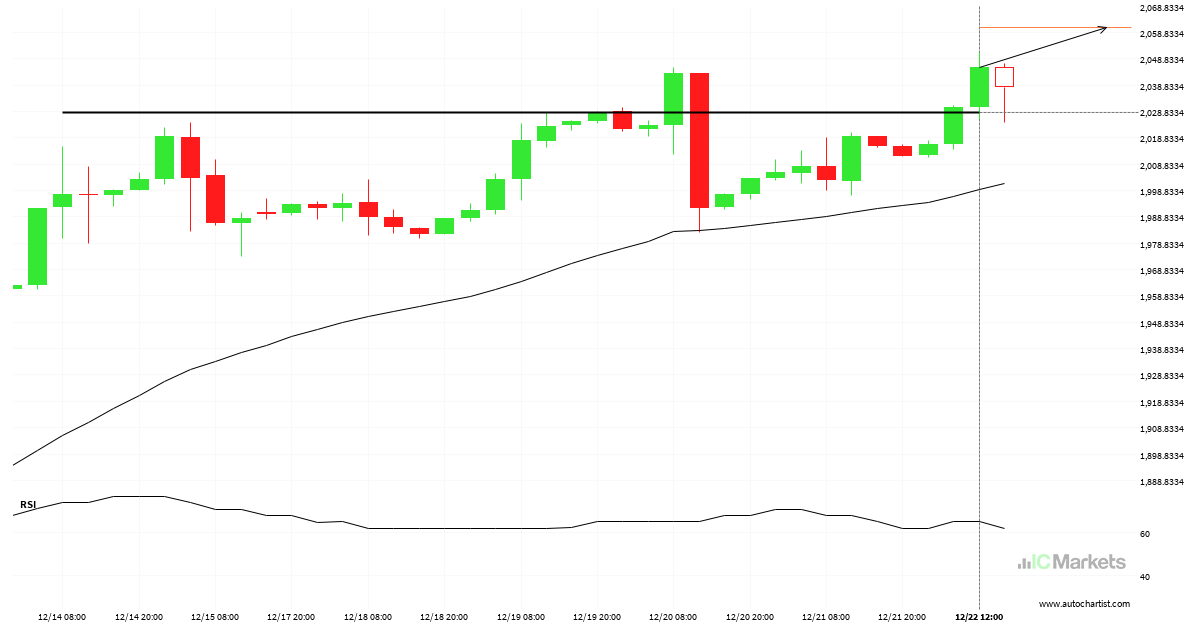
Rotura de US Small Cap 2000 Index a través de nivel de resistencia

Se ha atravesado un fuerte nivel de resistencia en 2028.4301 en el gráfico de 4 Hora de US Small Cap 2000 Index. La teoría del análisis técnico pronostica un movimiento a 2060.5371 en el próximo período de día.

Read more
December 21, 2023North_American_Stocks_esIC Markets

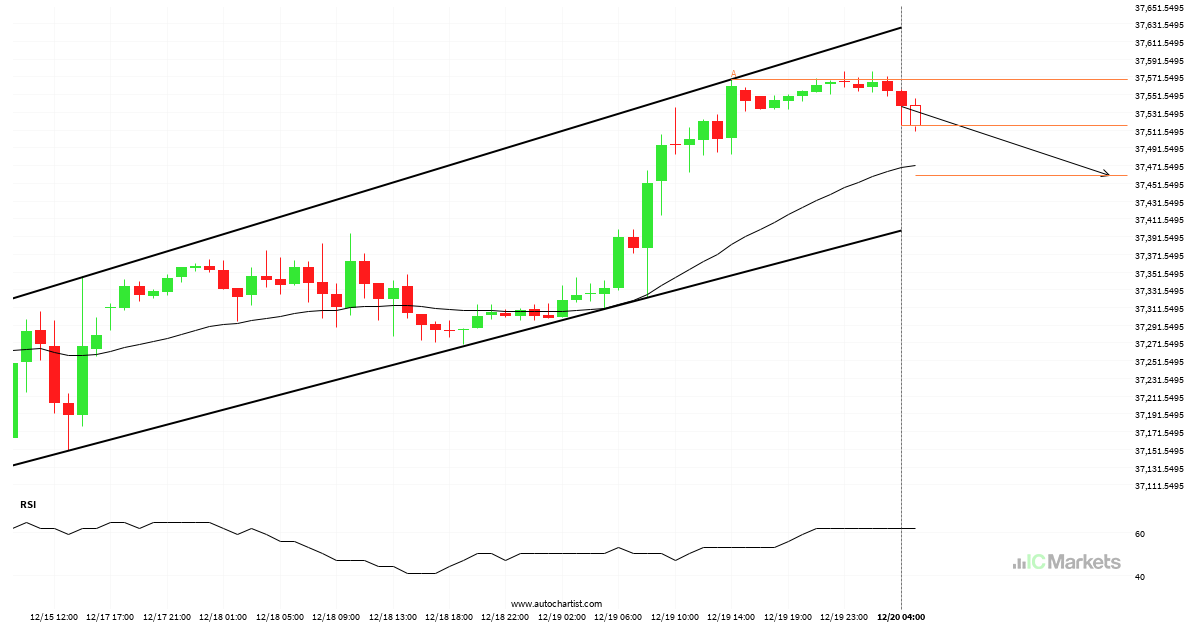
El US Tech 100 Index se aproxima a la resistencia de un Cuña ascendente

El US Tech 100 Index avanza hacia la línea de resistencia de un Cuña ascendente, que ya ha probado varias veces en el pasado. Hemos visto un retroceso antes desde esta línea, así que en esta etapa no está claro si atravesará esta línea o se recuperará como lo ha hecho anteriormente. Si el US […]

Read more
December 20, 2023North_American_Stocks_esIC Markets

US Wall Street 30 Index – acercándose a el soporte del Canal alcista

El movimiento del US Wall Street 30 Index hacia la línea de soporte de un Canal alcista es otra prueba más de la línea que ha alcanzado en numerosas ocasiones durante el pasado. Esta prueba de la línea podría ocurrir en las próximas 18 horas, pero no sabemos si dará como resultado una ruptura a […]

Read more
December 19, 2023North_American_Stocks_esIC Markets

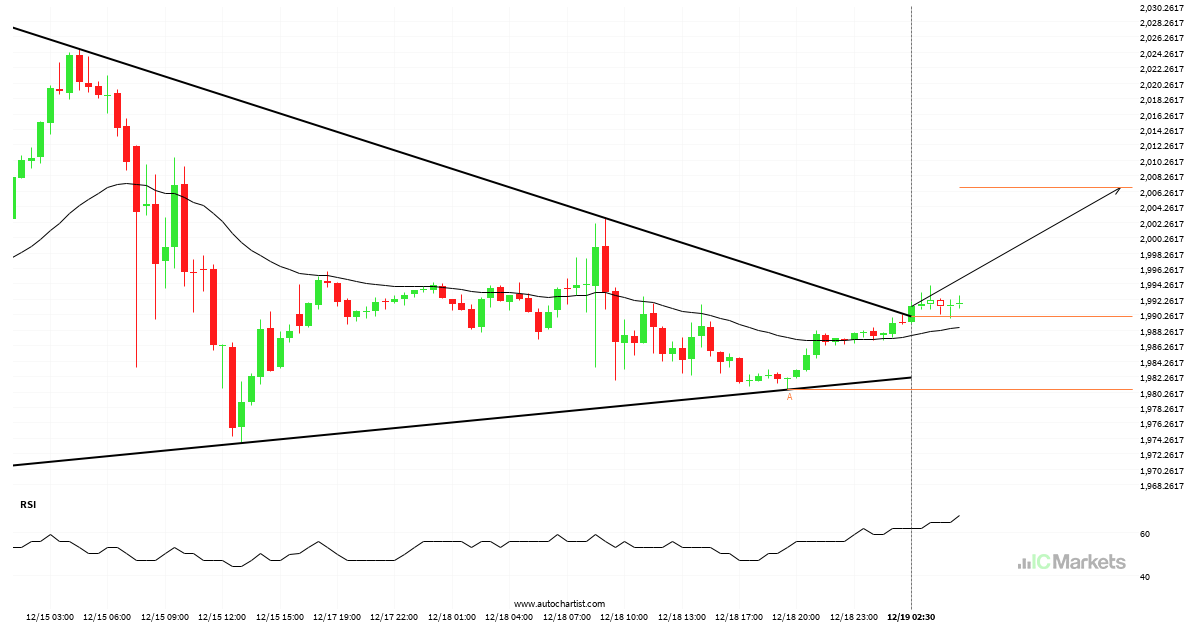
US Small Cap 2000 Index – Línea de resistencia rota a las 2023-12-19T09:00:00.000Z

El US Small Cap 2000 Index ha atravesado una línea de resistencia de un patrón de gráfico que corresponde a un Triángulo. Si esta irrupción se mantiene, podríamos ver el precio del US Small Cap 2000 Index probando el nivel de 2006.7541 dentro de las próximas 11 horas. Pero no se apresure si desea operar, […]

Read more
December 18, 2023North_American_Stocks_esIC Markets

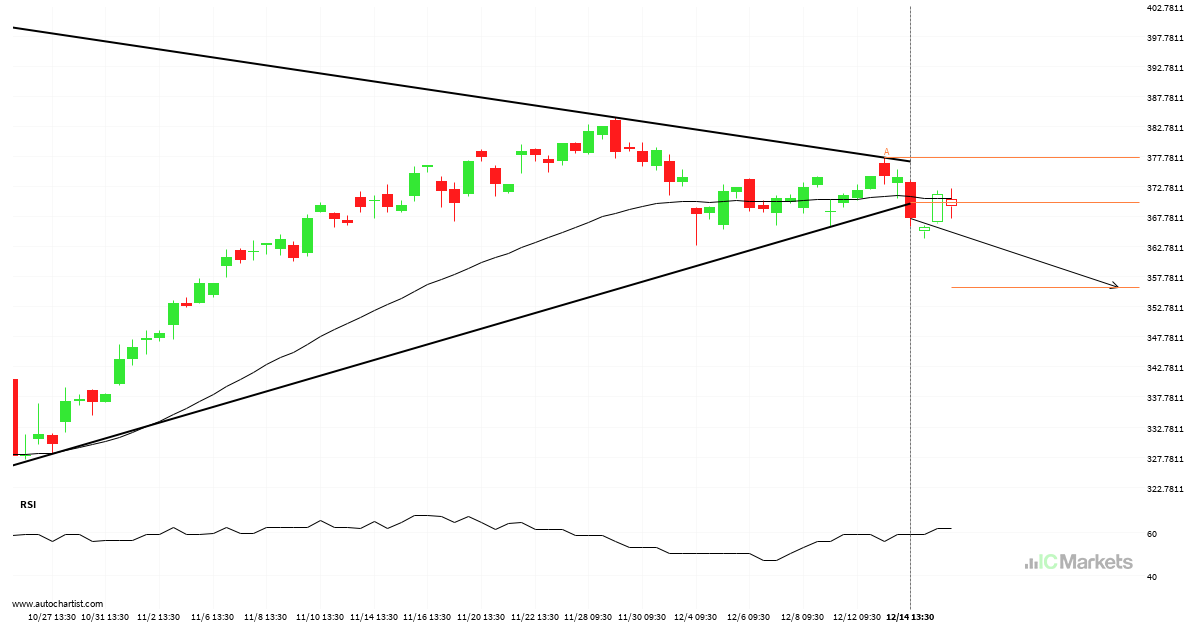
¿Se espera una tendencia bajista para el Microsoft Corporation?

El Microsoft Corporation ha atravesado una línea de soporte de un patrón de gráfico que corresponde a un Triángulo. Si esta irrupción se mantiene, podríamos ver el precio del Microsoft Corporation probando el nivel de 355.9873 dentro de las próximas 3 días. Pero no se apresure si desea operar, porque ya ha probado esta línea […]

Read more
December 15, 2023North_American_Stocks_esIC Markets

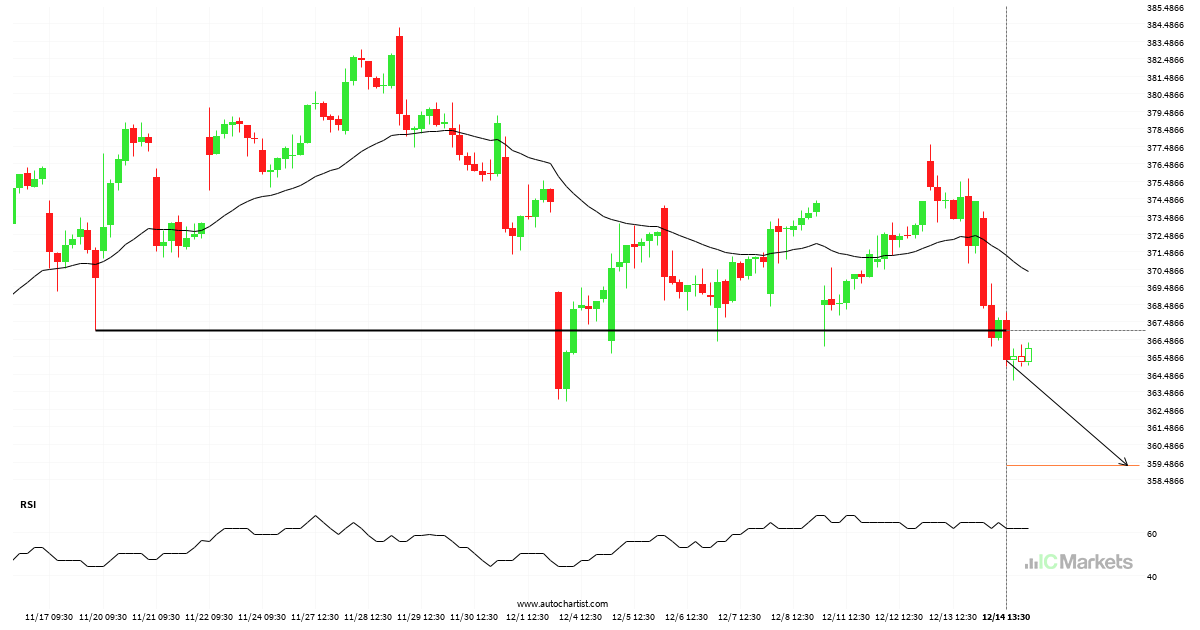
Microsoft Corporation – línea de precio psicológico atravesada

Microsoft Corporation ha roto la línea de soporte en 367.0100. Puede continuar la tendencia bajista hacia 359.3080 o puede resultar ser otro testeo más de este nivel.

Read more
December 14, 2023North_American_Stocks_esIC Markets

¿Es probable que AbbVie corrija después de este gran movimiento?

AbbVie dropped de manera pronunciada durante 8 días – lo cual es un movimiento excesivamente grande para este instrumento; superando el 98% de los movimientos de precio pasados. Incluso si este movimiento es una señal de una nueva tendencia en AbbVie, hay una posibilidad de que presenciemos una corrección, no importa cuán breve sea.

Read more
December 13, 2023North_American_Stocks_esIC Markets

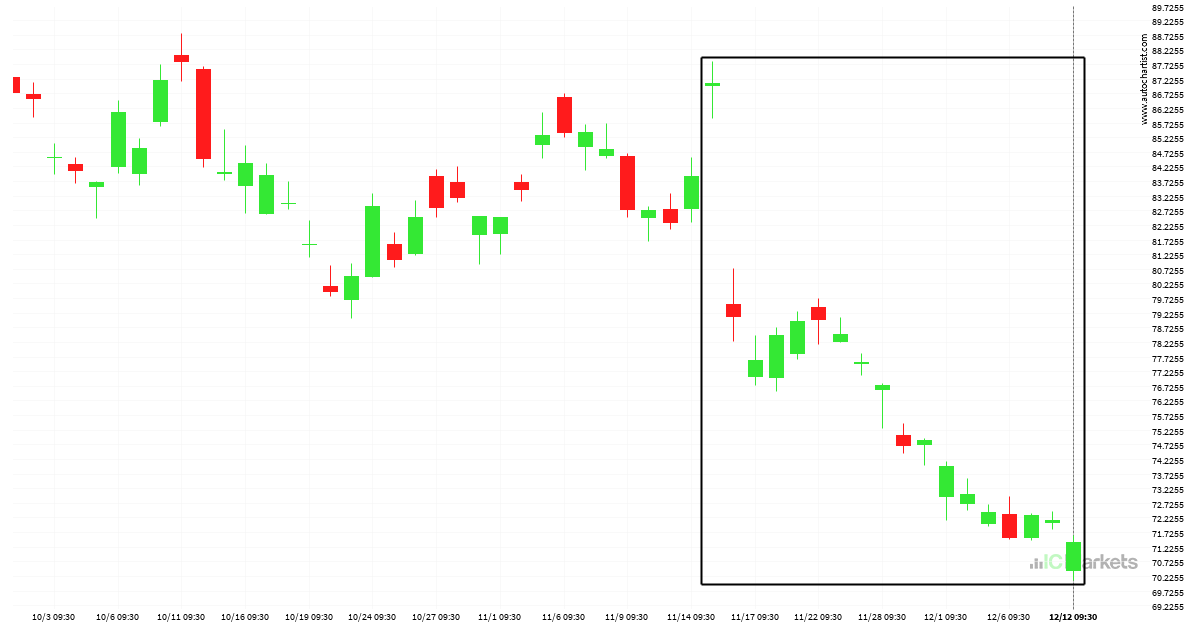
Extraordinario movimiento bajista del Alibaba Group Holding Limited

El Alibaba Group Holding Limited ha descendido un 18,04% de 87.08 a 71.37 en 28 días.

Read more
  • 1
  • 2
  • 3
  • …
  • 20
  • 21
  • 22
  • 23
  • 24
  • 25
  • 26
  • …
  • 89
  • 90
  • 91

Recent Posts

  • Either a rebound or a breakout imminent on SILVER
  • GOLD Nível visado: 2976.3601
  • A potential bearish movement on GOLD
  • มีโอกาสเกิดการเคลื่อนตัวแบบ bearish บน GOLD
  • Posible gran movimiento en el AUDJPY

Recent Comments

    Translation


     Edit Translation

    Trade with

    a market leader you can rely on

    Open Trading Account Try a Free Demo

    Forex Trading

    • Accounts Overview
    • Open an Account
    • Launch Web Trader

    Trading Specifications

    • Spreads and Commissions
    • Range of Market
    • Trading Hours
    • Funding
    • Withdrawal

    About IC Markets

    • Help Center
    • Why IC Markets
    • Regulation
    • Legal Documents
    • Contact Us


    Forex Trading

    • Accounts Overview
    • Open an Account
    • Launch Web Trader

    Trading Specifications

    • Spreads and Commissions
    • Range of Market
    • Trading Hours
    • Funding
    • Withdrawal

    About IC Markets

    • Chat with a Specialist 24/7
    • Why IC Markets
    • Regulation
    • Legal Documents
    • Contact Us

    Disclaimer: This material is marketing material where all marketing material is published for informational purposes only. This material does not contain and should not be considered as containing - investment advice and recommendations, or suggestions for performing any actions with financial instruments. The built-in widgets belong to their external independent authors, and IC Markets is not responsible for their content and their impact on trade.

    All content rights reserved. Opinions of the authors may not coincide with the opinion of the blog editors. When copying materials from this site or connecting to an RSS feed to republish our articles, a link to IC Markets or attribution in the format ‘IC Markets Blog’ is required. For general questions, please contact the editorial office via the form on the Contact us page.

    Risk Warning: Trading Derivatives carries a high level of risk to your capital and you should only trade with money you can afford to lose. Trading Derivatives may not be suitable for all investors, so please ensure that you fully understand the risks involved and seek independent advice if necessary. A Product Disclosure Statement (PDS) should be considered before entering into a transaction with us.

    The contents of this page are general information only and does not take into account your personal situation, financial objectives or needs. It is up to you to make sure the products that we offer suit your specific needs. You should not trade with us unless you understand the features and risks of the products that we offer. This means that you might need to seek independent advice before you start trading with us.

    © 2022 Raw Trading Ltd | All rights reserved.
    • Sample Page